Thursday, June 11, 2020

The PSE is being hacked by "Market Hackers" and YOU are one of them!

So if you've read my previous blogs on the matter, you should have known by now that while we do play the market, we believe that is a RIGGED GAME. This is something we would want you to have an open mind about and discover for yourself. Just like in any computer system, there are black-hat hackers trying to profit out of the misery of others. However, there are also white-hat hackers who expose the deed and traps being set. They equip people with technologies and techniques to discover these using charts and market research. We would be glad if you'd be part of the ethical white-hats who make it more profitable and stable for everyone than black-hats who hype the market using fake accounts, fake groups, fake news as these fake gurus hide in a shroud of anonymity. 
Spy vs Spy Wallpaper HD ®....#{T.R.L.} (With images) | Canvas ...

Being a trader (which I shall call Market Hacker for this subject) is not easy, you need to know the ins and outs of the system and you can never become one (Black or White) if you blind yourself from the reality (that there is a battle going on with Traders vs. Traders and worst... Humans vs. Machines). Add the fact that both sides are now use trading bots with powerful connections to the market (high frequency trading), they can pump and dump the market on opening and last price to confuse any trader whether trading for the shorter or longer term.

I would recommend first that you read my previous blogs (although not necessary for this topic)
What is a system and what is it "not to hack"?
A system, just like your operating system, a computer game, business process, etc. runs on rules! example is a rule in society that says "No Jaywalking". In a world where everybody follows the rules, it is so much fun right? wrong! because turns out someone got ahead of other people by jaywalking! they got around 20% faster and became more productive as a result. they got the promotions for being always ahead of others and not sweat staying in the sun's direction. Upon learning the technique, the law-abiding population at a rate of 10% per day switched to becoming violators as the risk-reward becomes more enticing. 

Have you played a new game that just got released for P3,000 and is now available on steam? oh you got yours for P200 only in Divisoria? complete with cheat codes? Awesome! you are also a hacker because you just hacked thru the system wherein a good citizen is expected to buy original products which supports the developer's hard work. Yet, you did not and even proudly explain "What idiot would pay these stupid developers for something they work hard for years" right? 

So! who has never violated a rule or two raise your hand! :D obviously none... Here is the simplest way to define a hacker in the terms of a System Engineer like myself... Whenever you bypass and violate a system's rules for how it is normally expected to work, you are already hacking and exploiting weaknesses in the system!

The Stock Market's System
It has a very simple purpose... to trade shares of companies whose worth is based on its fundamentals. If a company's Assets are growing, its share value grows with it! if the Assets are declining and business is dying, its prices obviously fall (at a well formulated price). This is because the stock prices have a simple formula of how the company is performing (growth rate, earnings, etc.). The rule is you use the fundamentals to see if one is overpriced or cheap, has potential growth or declining, has sound leadership or corrupted, and so on. and with that, The rule is "Invest on good companies and sell the bad ones based on their financial scorecards". With fundamentals, the market is sensible and more predictable. 

But something happened along the way such that fundamentalists are being killed by the increasing breed of "violators". The lazy generation and the availability of stock trading has given the rise to "Stock Trading" and when I say trading I mean it. You are not an investor, but a merchant who buys low and sells high based off market demand. But that is not where the true hacking is of course! Eventually everyone has to buy something and sell something when the time is right. Market hackers however aim for compounding their wins by following trend cycles. As cycles happen every day, week or month, market hackers have their eyes fixed on the monitors (or bots) and are ready to trigger on their signals.

This is why the market becomes more and more volatile as the number of traders increase who uses different techniques outwitting each other. 
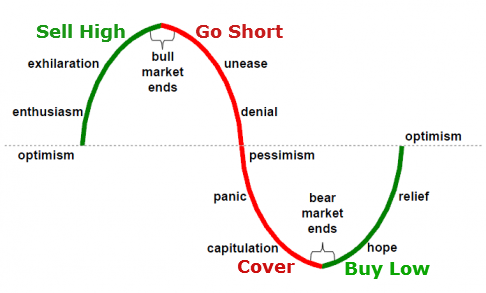
Buy Low, Sell High, Go Short & Cover Summary - The InvestWithAlex ...

Traders are not limited to people who work on a job and trade the markets which are the majority. But you should never worry about those guys, those are C-class Market Hackers. What you need to worry are the big guns. There are bigger hackers at play like the NEWS Media outlets, The brokers (who knows or controls your orders and can use the volume to manipulate the market), The Guru's and Experts who profit more on the advice than their stock trades and of course the Companies themselves who are free to do insider trading with no repercussion (specially in the Philippines). So if you have not read that article yet, please click here.

Know your enemy's disaster level
“If you know the enemy and know yourself, you need not fear the result of a hundred battles. If you know yourself but not the enemy, for every victory gained you will also suffer a defeat. If you know neither the enemy nor yourself, you will succumb in every battle.”
― Sun Tzu, The Art of War
There's A ONE PUNCH MAN Fighting Game Coming Out Soon! — GameTyrant
  • Wolf (Outsiders like you and me)
  • Tiger (Gurus, Fake news propagator, Fake trading group admins)
  • Demon (App and Platform owners, they monitor and learn your trades along with others and can use them for their advantage.Worst the apps could have viruses on them)
  • Dragon - (Big Companies doing insider trading and uses their media extension to cause market turbulence) 
  • God - (Big Financial Institutions who can pump volume in a market)
 

ASTRA aims to help White Hat Hackers
So then why is ASTRA reading trends and much like similar market tools made available, rely on trends and not fundamentals. Well, because ASTRA believes this is the "new normal". It is not that fundamentals are totally dead! that is for us to utilize and it is used to support your stand on your investment! ASTRA is just focused on trade behavior analysis and shares it to us so we can get a sense on how the market is trending. It believes the market is rigged because it aims to learn, visualize and expose incidents of potential market manipulation so others can avoid these traps. 

We who are part of developing it are also victims of these traps before and this is why we made ASTRA to help others learn and avoid them in the future. We share this freely as it may help you guys in your trading journey. Whether it helps you or not, remember that "In stocks you should never blame anyone or anything! because at the end of the day, it is you who pulled the trigger"

Monday, June 8, 2020

Why and how the PSE is rigged

Manipulation in Marketing: How It's Used, and How to Use It Ethically
Like I said, the Philippine Stocks Exchange is rigged. We have companies that do not file accurate financial statements (as they add a lot of accounting magic to them). Most are more involved in political activities than business, have cases of AMLA, links with shady organizations and violations where no one gets punished at all. But this is not the worst part. The worst is that these companies also play the market, something not allowed in 1st world countries that lands people in jail and companies being penalized in billion to total shut down. So lets break down how the big companies manipulate the market and how they victimize traders and investors.

NEWS
811 Best Media Bias and Control images in 2020 | Media bias ...
This is already a given to most. An entity that promises to provide unbiased and up to date report on what is happening in the country or across the globe. Led by people of "high integrity" and is not affiliated with anyone nor protects anyone. Just pure integrity news source right? This is the biggest joke people still believe in. The NEWS Network just like any other programs rely on funding to operate. There is no such thing as charity and everything has a price. The NEWS networks are funded thru Advertisements, Sponsors (even foreign states) and business interest groups. If you are the news network and you are to be paid millions not to air a report exposing and damaging a company, rather they want you to promote them, then that will be the NEWS. This is how they turn victims into villains and the perpetrators into heroes. There is a saying that if the NEWS is spreading bad news, be on the hunt for opportunities. If they keep spreading good news, be on the lookout for dangers ahead.

Brokerage Firms
These are companies who provide platforms for people to trade their stocks which is great. Popular ones include FirstMetroSec and ColFinancial.  But you have to understand, having such control also means they would have an edge playing the markets. They can see thru trades being planned before and after market hours. They can time the market with ease compared to the average traders. The worst though which most traders and investors will encounter are intentional slowdowns and inaccessibility. If you have been trading for quite some time, you would encounter sudden slow downs where you either take so long to submit an order and unable to buy or sell on time, or you just cannot log-in at all. These are not one-offs and the local brokerages make different alibis and excuses but never fix them. Why fix something that is actually a feature than an issue right? because I tell you, this feature they have has existed since I started using them in 2007! Notice whenever this happens, the market drops, this is their way of "Shaking off the people"

Fake News, Fake Groups and Fake Accounts
Fake accounts, fake accounts.... Everywhere!!! - Toy Story Meme ...
This is similar to NEWS above but is more malicious. If you imagine them to be like some alien parasites, its their way of "blending in the crowd" and pretend to be down to earth. act like a human, talk like a human, mingle with humans, then talk about opportunities in their space. The Media uses it and Big corporations to get market sentiments and also stealing private data in a blanket wrap they call "know your customers" of KYC. Fake accounts have become so important as well nowadays as they use them to generate fake likes (illusion that something is popular) and fake reviews (to spam comment sections with comments praising or destroying specific people, group, company or product).

Insider Trading
Investor Juan: Geographical Diversification, Part 1: A Second Look ...
If you know someone on the inside, that would be great. This is because whether you like it or not, the market is definitely rigged from the inside. If companies play their stocks, then any trader or investor who are outsiders have already lost. It is the same as gambling with someone who has arranged the order of the cards. This is why one of the key decision factor of fundamental investors is to know which people are in the executives and board. A company with unethical and cunning leadership is not worth investing with. all they will be focusing is hyping and crashing the company's stocks while they reap people off. If the company is losing sales and not growing, but grows has lots of stock market activities, then products and services is not on their priority list nor is it their main source of income. Notice that no one has ever and can ever be punished for such in the Philippines.

Accounting Magic
8 Best Accounting Quotes images | Accounting, Accountability ...
Knowing how much window washing is done by companies in the country is enough for me to say "fundamentals" are "technically" dead. I would be happy to invest for example on RCBC and BLOOM (Solaire) due to how much they stole from the Bangladesh bank (Money laundering). However I believe such "profits" will not add to their Financial Reports for the benefit of the investors and are pocketed by the several people for the job well done. Like that, same to what I just said, no one actually gets punished in the Philippines so corrupt behavior is an acceptable norm.

My two cents
This is not to make you spooked from investing or trading in the PSE. But some things you need to be aware of than walk around it blindly. There may be other issues you have encountered that is not listed here but these are most of the major issues we see about the Philippine business environment that makes it one of the most dynamic and dangerous to put your money into. Until the government enforces the law correctly, the Philippines (and of course Filipinos as a whole) will be seen as one of the most corrupt, emotional and unpredictable in comparison with its neighboring countries who are stepping up and surpassing us in almost everything.

Sunday, June 7, 2020

ASTRA Reports: Average Trade Value

The ASTRA System provides a report called the Average Trade Value (see here) which ranks the stocks with the highest 5-Day Price-X Moving Average. This enables us to dilute those stocks that are being hyped for a day or week only to mess unaware investors and traders. There are two versions of this report. The Top 100 (ordered highest to lowest) which are stocks ASTRA wants you to focus on, and the Bottom 100 (ordered lowest to highest) which ASTRA recommends you to avoid. This report is all about trend and by trend, we mean not just by volume but by overall trade value.

Volume vs. Value
So why do we say value? well simply put, in stocks, value means more than volume. You can tell me you bought a thousand shares of stock X for 10 Pesos and sold it twice the amount and earned you another 10 thousand pesos. I on the other hand bought 100 shares only of Stock Y costing 1000 pesos and sold it also for twice the amount. it gave me 100,000 more. so who earned more or made more noise that day? me because I made more value. The same in stocks, a penny stock stating it made billions of volume traded the day means nothing as it will not impact the PSEI unlike the big transaction value makers. and the more transactions they produce, the more popular they are.

Form your Basketball Team
I love explaining things as a game! Everything to me is some form of game that has rules, players (actors), rewards and punishments. So I will explain the game play in the most relatable game to us Filipinos... BASKETBALL! So! you own a basketball team and you need at least 5 players to handle different positions. You will also need some bench players in case they are tired or retiring. You will also need to draft some new candidates who will join your team.

Mission:
  • Form a portfolio of 5-10 stocks
  • The main 5 active stocks should always be unique. This diversifies your portfolio in case a specific industry you focused into fails.
  • Unlike real basketball, your bench players are not inactive. Let's just say they are "training" or being warmed up. These are stocks not in the buy and hold but more of those sleeping "potential stars". If they go down, usually you use Double Down Cost Averaging
  • Draft 5 stocks that are not part of your portfolio and monitor them. When they are ready, replace an aging, declining or dead stock in your portfolio.
  • Do not exceed 10 stocks, you cannot monitor them all or trade fast enough when you see all become bearish at once. This will cause you to panic specially with the crappy services most of our trading platform offers (see here for my take on the PRO's and CON's of the 2 platforms I use as well)

You can choose your best stocks from the Top 100 list. I do not recommend anything beyond that specially the Bottom 100 List. But if risk is your play style and you have more tools in your arsenal that gives you that edge then go for it! Me however, I am highly concerned into trends and thus even limit my draft picks to the top 20 only. This means I tend to miss out potential 1-day 30% growth or double your money events from more volatile and emotional stocks. however it protects me from those "lose half your investments in a day" kind of stocks as well.

Caveat: You can have zero active stocks as well. specially in bear markets. It's up to you if you do not follow the rule of having your 5 to be unique. You can have 2 forwards, 3 point guards at the same time... I mean 2 logistics and 3 banking stocks  at the same time but note you open yourself to risk if the industry overall falls together.

Why you should not be selling at just +1.5% gain

If you are a new trader in the PSE, please know that transactions (Buying or Selling) are not free. It has charges that you can consider as "sunk costs" and that also means, when a stock value goes down and you decided to cut losses, you do not only lose the difference but also lose money on the transaction itself.

The common charges apply for your all buy and sell transactions
 Fee TypeAmount  RemarksValue at PHP10,000 
 Commission 0.25%of the gross trade amount  25.00
 Value Added Tax (VAT)12% of commission3.00 
 PSE Trans Fee0.005% of the gross trade amount 0.50 
 SCCP Fee0.01% of the gross trade amount 1.00 
 TOTAL 0.295% of the gross trade amount  29.50

Selling adds another fe called the Sales Tax
  Fee Type  Amount  RemarksValue at PHP10,000
 Sales Tax0.6% of the gross trade amount   60.00


To ensure that you earn money from your trade, your break even price is 1.21% of your capital (without any buy or sell transaction charges). Until you reach this amount, you are earning almost nothing.

Saturday, June 6, 2020

Battle of the Stock Trading Platforms (Feature breakdown of COLFINANCIAL and FIRSTMETROSEC)

I have only used 2 stock trading platform so far and never tried any other new ones since 2006. If given the chance I will try the rest but so far,, I will share to you the PRO's and Con's of these two and why I would recommend one over the other.

Monsterverse Godzilla vs. Kong Fan Art by Fang Pu - Godzilla Fan ...

 Feature First Metro SecuritiesCol Financial 
Off-market orders

Allows you to set GTD, GTW and GTM orders which just mean Good till day, week or month. Because of this, you can perform stop losses and buy-in strategies that trigger when the time price hits your thresholds. WINNone. It is very limitted in this feature and only allows you to trade on market hours. This disables you from catching open hour prices and also positioning your stop losses. LOSE
Multiple TabsAllows multiple tab sessions thus making it easier to navigate between trades and screens without needing to refresh the page each time. This lessens back and forth and trade delays because you need to go back and look at your portfolio at the same time when buying a share of stock 1 and sell stock 2. WIN Does not allow multiple tabs. you are stuck on one screen and thus if you need to sell and check a new stock, you will have to do them in a linear fashion. if their site slows down to respond 10 seconds per page, you would have lost 20 seconds trade time when you want to confirm password and then by that time, you are too late and noticed the prices have changed. LOSE
 Stock Quote viewAllows you to see the Top 10 BIDS and ASKS.This helps you see where the support and resistance levels for the day are located WINOnly allows you to see the Top 5 BIDS and ASKS thus limiting your view. LOSE
 Technical Analytics Shows several analytics on its analytics tabs but I find it misleading (i.e. RSI). It will say a stock is BULLISH when in our analysis the trend is dying. not sure how they were computed but I cannot trust it's analysis. LOSE It provides technical based recommendations in its [Research->Technical->Technical Guide] menu. It will provide you the action to take on all stocks which seem to be on par with our trend recommendation system. WIN
 ChartsTheir charts are ugly as hell as they slapped everything in a limitted screen full of scrollbars. LOSEHas a more simplistic intra-day chart which can relate for day-traders WIN
 Trade MonitoringAllows you to make a bucket list of stocks you are interested in and monitor these. (Quotes->Multiple Bids) 
WIN (because of multitab)
 Also allows you to monitor these on Quotes tab under six-pack and watch-list. However because you need to navigate in and out of these each time when you want to perform a different action, your experience will be so annoying and will cripple your ability to time the market. LOSE 
 Other Investments There seems to be nothing else that can be bought here other than stocks LOSEAllows purchasing mutual funds (if that is your thing). WIN

Conclusion
First Metro Securities with the first 3 critical features make it obvious win. The rest of the feature do not add up to beat this. As long as COLFINANCIAL does not allow multi-tabs forcing their users to be limited in their movements, and also not enabling them to make scheduled trades and wider view of the market BIDS and ASKS, users of their platform will miss out on what First Metro Securities offers. Note these are my opinions only so you may have a different experience or tools of preference. If you know something that is better than these 2 please feel free to suggest in the comments bellow. Thanks :)

Double Down on Cost Averaging

Financial Tips for the Holidays.

Just do cost averaging they say... you won't lose they say... you will be rich one day if you do it constantly they say... but when I checked my result after years of cost averaging... WHY IS MY PERFORMANCE AVERAGE? This is another common advice given to newbies. While it does work, it reduces your potential gains. It ensures one thing... "your gains are average as well". So for those who do not know yet, Cost Averaging is setting  a discipline of buying on certain days (ex: your payday) on particular stocks religiously. This is not bad for people who are not truly active or want to really mess with market fluctuations and market timings.

The chart below will show 6 months worth of trends from month #0 and assume they sold their shares on month 6 (July Peak).
 MONTH NEW
SHARES
PRICE TOTAL
COST
 TOTAL SHARES TOTAL COSTTOTAL PORT
VALUE
PRICExSHARES
 JAN 100  50  5000 100 5000 5,000
 FEB 100  45 4500 200 9500 9,000
 MAR 100 40 4000 300 13500 12,000
 APR 100 45 4500 400 18000 18,000
 MAY 100 50 5000 500 23000 25,000
 JUNE 100 55 5500 600 28500 33,000
 JULY 0 60  600 28500 36,000 SOLD

So you see, using such method, you get a somewhat average gain of 7,500 pesos if you decided to sell on July(at 60 pesos)... It is not that bad, however you could've increased the earnings rate further by not buying into the bull and have focused while the market is lower.

 A better use of cost averaging which I use is what I call "Double Down Cost Averaging" to start cost averaging on stocks you know to have potential upswing but are hammered. For example, buying into a stock that seems to be losing downtrend momentum and about to go up. Did It fell off by 10-15% or more in value?  Instead of exiting, inject double of the original stake. You can see this in your COL or FMS accounts as % change. Then once it starts kicking up, STOP your cost averaging... 

Lets say the market happened similar to the previous sample. on Feb and Mar, the stock was still being hammered. so instead of buying the normal 100 per month, double down. I buy if I entered and the market is still falling but if its rising, I do not dilute my potential gains and would rather focus the money on a different prospect.

 MONTH NEW 
SHARES
PRICE TOTAL
COST
 TOTAL SHARES TOTAL COSTTOTAL PORT
VALUE
PRICExSHARES
 JAN 100  50  5000 100 5,000 5,000
 FEB 200 45 9000 300 14,000 13,500
 MAR 400 40 16000 700 30,000 28,000
 APR 0 45 0 700 30,000 31,500
 MAY 0 50 0 700 30,000 35,000
 JUNE 0 55 0 700 30,000 38,500
 JULY 0 60  700 30,000 42,000 SOLD

So if you decided to sell on July, you will earn 12,000 pesos compared to above (60% more). I am not saying this always works though and its just how I play. Also if the stock you are playing is wrong, then you have just amplified your loss. So the goal of this strategy is that once it is green and continues to go up, the only concern on your mind should be exit strategies (where and when to put your sell positions).

Thursday, June 4, 2020

Mutual Funds and VUL (Insurance).. are they better than personally doing stocks?

New investors (young and old) are often easy targets of scheming sales people. And when I say "salespeople", those who hide under the guise of "investors", "financial advisors" and "gurus" but are actually "sacrificing" their time more on hunting for someone like you (so that you will become rich and smart just like them?). Strange... very strange...

Why did Doctor Strange raise one finger to Tony? What was the ...

I am not saying everyone as there are several honest and good willed people out there. But I will arm you to be defensive and cautious as I have seen a lot of these snake-oil salesmen misrepresenting their products for the sake of getting sales more than wanting you to truly understand their products and see if it fits your needs. These products have their own PROs and CONs but most of the time, it limits your opportunities because these products feed on your potential gains more than they can amplify.

Mutual Funds 
Lets say you do not want to bother trading stocks everyday. you find it hectic and you don't care of learning it. You want to put your money in and let it just grow by itself. If the market is falling, then it will just balance itself out and on average, it should average at 12% Well then this is probably for you might say but NO! first do not be fooled when the show you some BS chart and idea that the stock market on average returns 10-12%. That is old recycled sales talk as now it moves around 6-8%. It changes with the times. Most mutual funds also are just eating your money and you are better off trading on the PSE index! trust me! if you expect them to trade on your best interest you are fooling yourself. 

VAVE Financial Planning - Photos | Facebook

On average they are just pretty much blind traders putting in money on an index or a portfolio mix and let it ride for life. when a bear market happens you will see that their units follow suit. Wait? did they not exit the market before it happened? I thought they are "experts"??? what are those monthly "professional fees" I pay them for then? Pretty sure they did, they will just show you what the market is doing and say "Oh... the market went sour so the value of units went down". but highly likely they have "shorted" these already (sold at high price and aim to buy later). 

So if your mutual fund just follows the market, you know its a sham and its like me taking 2% cut of your potential earnings if you had just invested blindly in the PSE index. If a mutual fund "expert" shows you their performance chart and they just follow the market (PSEI), leave! because he is just basically putting your money on the index and sleep. All that while charging you thousands a month on "professional fee". You should only pay professional fees on true traders who beat the market, those who can sell before the crash and buy before the boom which makes your investment grow continuously, thus beating the market for more than what he charges. 

VUL (Variable Unit Link Insurance) 
This is a very common offer in the insurance industry. Insurance is good if you have beneficiaries, but if you don't have one why are you buying these for? Insurance is like a lottery where you hope that you can die today so you or your family will become rich for a fraction of that "investment". This is something you renew and pay every year until the day they claim you are no longer insurable. That time the relationship is like "Thanks for your years of paying us for nothing... but at least you should be happy because turns out you are rewarded with a longer life than the average :)".

Now what is VUL. They may sell you this product under a different name (VLL, HoneyPot, Pikachuchu or Wachamacallit) but as long as you see "insurance" + "investment" or "pay periodically until X years" and they claim "you will no longer need to pay insurance after that" then chances are its a VUL. A VUL is basically a product sold as one but is actually two products. An "Insurance" and a "Mutual Fund". 

Amazing so I have a mutual fund that also gives me free insurance after 10 years? or was it an insurance that I paid in advanced that gives me free mutual fund units? Close but you gotta remove the free part most of these "salesmen" try to hide from you. Nothing is free coz if it was, the insurance industry would not had become one of the richest businesses specially in fear driven economies. Now with that said, as it has a mutual fund portion, that means the same rules apply. What agents will not tell you unless you ask is that they will eat your fund using the "professional fee" for their in-house expert who is just as good as falling along with the index. if the market crashes, so will their units. No hedge strategy? no cut-loss? Nope! just pure incompetence from "financial experts" who fare worst than average traders.
Insurance, The FBI, and Custom Efficiency

The reality is that you are buying 2 things at the same time for X years. an insurance and a mutual fund. let me give you a sample. lets simplify and say you only need 5 years of paying 5k a month or 60K a year. lets also assume the market grows at a constant rate of 6%  annually for its previous value. Do not believe their sales talk by the way that the market grows at 10-12% on average. You are not talking to investors but sales people living off on selling products. They do not know what they are saying except for the sales pitch they recycle. The average is 6-8% and it changes depending on several factors. But they will claim 10-12 is average when its not because most buyers who get lured only get to learn this after they decided to claim and complain (or not because yes! they freaking DEAD!) :D

The chart below shows that your annual payments get split into 2 pools. Insurance and the "investment". The first years would be higher because usually they use it as payment for the premium of the insurance. It gradually decreases until after 5 years, congrats! you no longer need to pay it! But wait??? why did you put some deductions for the succeeding years and who is paying for that? Some will claim "oh! its the company who is now paying for the insurance"... wow! how nice of them right? nope!

 YEARANNUAL Insurance
Payment 
New 
Mutual Fund
Investment
 Total MF Unit Value Unit growth @6%
 1 60k  40K 20K 20K 1,200
 2 60k 20K 40K 61,200 3,672
 3 60k 10K 50K 107,570.86‬ 3,672
 4 60k 5K 55K 169,025.11 6,454.25
 5 60k 5K 55K 234,166.62 10,141.51
 6 0 5K 0 239,308.13 14,358.49
 7 0 10K 0 243,666.62 14,620.00
 8 0 10K 0 248,286.62 14,897.20
 9 0 20K 0 243,183.82 14,591.03
 10 0 20K 0 237,774.85 14,266.50

If you do the math you will see that it actually "leeches" of your mutual fund account. Imagine having a bank account with an interest rate of 6% (Nice!) but then there is this auto-debit account from your gym membership that can control their monthly fee and just keep raising it each year? 

This is how the scheme works and is where people who claimed the insurance get shocked that after X years have passed, they discovered that they paid more than what they will receive which is too different from the sales pitch given. because unlike normal insurance, only you have access to your bank account and can decide if you will still get an insurance for the year or just accept nature and not bother with it. A VUL however means that the insurance company has access to a "bank account" which you had with them and can eat into its fund value by forcing the insurance portion to auto pay premium priced insurance annually, specially if when you are older. Notice in the exaggerated sample, the value of the fund, even with the constant growth of 6%, can no longer sustain the insurance feeding off of it. Year 9 and 10, the value is decreasing and with that, the 6% growth value. This is how the insurance makes money. But you won't need to worry about that much because by the time you realized it... you DEAD man! :D

Conclusion
If you are young and is starting to learn investment, play the stock market. Get some bruises and lose some! That is what investors call "tuition fee". what you will learn will be better than what you pay monthly to a mutual fund trader. If you are however not in any way interested in learning and bother with stocks and would prefer finding someone who will trade your money seriously. Find a good mutual fund trader like me (joke!). You need to find a serious investment firm that has a track record of beating the market and not listen to salesmen who do not even buy or use their own product.

If insurance is already something truly desire, then the VUL is better than plain insurance as it enforces you to pay now for something that you might not be able to in the future. A security for your loved ones left behind. Also note that it is harder for your dependents to claim your stock portfolio (when you suddenly blink out of existence). Stock brokerages do not have an option for you to specify who will claim your shares and thus, once you are gone, it is basically theirs... and thus, that is where the insurance becomes quite a bit useful. 

Wednesday, June 3, 2020

Breaking down ASTRA's TRENDEX Chart

If you looked inside The MyPinoy Network's quote pages, you will find this weird chart that looks kinda like the candlestick chart but seems to be unaligned with it. What the heck is it? We couldn't find a better name and just decided calling it the TRENDEX Chart. It utilizes the Price-X value so you should first look into that article before going here.


Let's break it down to its most simple component... the Box-Plot. So in statistics, a Box-Plot shows your the 5 Number Summary. It allows you to see the distribution of a particular arrangement of datasets.Confused already? lets explain... imagine you have the following 15 data
DATASET = 11, 12, 12, 13, 15, 15, 18, 19, 19, 20, 22, 22, 24, 26, 30 
The 5 Number summary will disect these and try to locate 5 important numbers
  • The Maximum (Highest number in the set)
  • The 3rd Quartile (The median of the "right half" of the dataset)
  • The Median (The number representing 50% of the population in the dataset)
  • The 1st Quartile (The median of the "left half" of the dataset)
  • The Minimum (Lowest number in the set)
So to solve this is easy, we know the minimum and maximum already (11 and 30) just by looking at the data. To get the median, you will need to locate (or impute) the number located at the center. There are 15 numbers so the median is 15 divided by 2 rounded up. that will be the 8th number which is 19. now we need to split the dataset into 2 groups from the median.
DATASET1 = 11, 12, 12, 13, 15, 15, 18
DATASET2 = 19, 20, 22, 22, 24, 26, 30

To get the first quartile, you need to get the median of DATASET1 and the same for the 3rd quartile for DATASET2. The result will be as follows.

  • Maximum: 30
  • Q3: 22 
  • Median: 19
  • Q1: 13
  • Minimum: 11
So what you basically see in each boxplot is the following

So to simplify, a Box-Plot allows you to visually see the "distribution" of prices for a certain number of 'N' days. In our case, we have made the 5 days (5D) TRENDEX Charts available so far (as we still need to collect more data to make longer term charts available as well as include newer data for you guys to use). In addition to the information above, you will see there's a yellow shaded area on the BoxPlot, this is called the SKEW which starts at the MEDIAN (RED) towards its MEAN (YELLOW EDGE) value. so if you are looking for what the 5 days MA (Moving Average) is... that is the edge of the yellow shaded area.

Whose that Pokemon??? Its TRENDY!
Let's give it a name... TRENDY! now lets visualize what it looks like for a moment...


Disgusting right? I mean... my artwork... Anyway, in the Box-Plot, you can see that Trendy "mutates", "evolves" or better to say "runs around" the area day to day. its movements in the past help determine what Trendy is up to and where it may be going the next day. Remember! nothing is guaranteed! that is why we often say "probable", "may", "can", etc. If someone tells you that something is 100% guaranteed, you are being scammed so abort! In Stocks and Gambling, it does not matter how many times you get it wrong! but make sure you get it right more than you get it wrong where the total ROR is a positive. This is why probability is the game and those who can easily see and utilize probabilities are winners in this game.

Here is how Trendy operates
  1. Trendy's eye direction tells where it is facing. if the yellow shade is above the red bar, it is facing upward and vice versa. It is where it is interested in going... the larger the "view" (The yellow ares which is the SKEW), the more it is "interested" to head towards the location. So we say "interested" but not necessarily where it will be because of the next item...
  2. Trendy only knows 1 direction, forward! to move backward (downtrend), it has to face down and move. Sometimes it moves too fast and has to "decelerate". this usually happens when it suddenly changes its "view" (performing a 180 degree) and decelerate (by skidding) from its previous momentum.
  3. When moving, Trendy moves kinda like a worm... it stretches its front body forward, then move its back-end forward eventually. If it did not move it's back-end however, it could be "reconsidering" the move forward.
  4. Its tongue and tail (Box-Plot whiskers) determines what it is trying to taste or feel.Its use so far is to determine "potential" areas where Trendy will move to (whether continue forward or just decide to step backwards)
  5. Contractions (shrinking) happen to Trendy when its contemplating its next move or asleep. This indicates market is trending sideways or indecisive.
Stream and River-flow
You see that light blue (Stream) and dark blue (River) line that kinda flows like a smooth moving average? That is the XVWMA (X-Price Volume-Weighed Moving Average) or what we can just call the "Stream and River-flow". Unlike basic MA (moving Average), it is "transaction volume" biased. That means if there are 5 trading days with equal number of trades per day except for the 3rd day which is 10x the normal transaction volumes, the river-flow will be more inclined to that day's X-Price. Trendy usually plays around the stream and river area so watch where it is potentially flowing towards.

The stream used 5 Days worth of data while the River uses 10 days. This means the stream is a week of market trades while the river is half a month or 2 weeks. Another mid term used for this is called the Road. These 2 short term trends help us see trends but may not be a strong indicator that the trend is stable. It is best to be used against longer trends to see the strength of the trend.

Road
This is a new feature release June 9th of 2020. It is similar to the stream and river but uses a 20 Day span. it is used for trading on a longer term than the river. Both are similar to MACD, only that these are based off the X-price and are also volume weighed meaning the prices are more aligned to the price with most volumes. Like MACD, you can utilize this to see bearish patterns whenever the RIVER crossess the ROAD

Heartbeat

The chart below it is the "heartbeat". It is composed of the N days trade value EMA. You will see its pulse changing over time. So what does it mean? well  to make a proper diagnosis, you will need to compare this with the other metrics. You will need to look at the "mutations" above it. Heart rate rises during 2 events, "panic" and "excitement" and the mutation tells you which is happening now. The growth rate or decline rate will also allow you to see if the trend is a one-off, consistent or amplifying.

Acceleration
Acceleration graph allows one to see if the trend is accelerating or decelerating from its previous momentum


It is percentile based from its previous momentum. It compares the delta of 5DXMA (5 Days X-Price Moving Average) against its 20DXMA (20 Days X-Price Moving Average) for that timeframe. Thus for example a boost of 100% acceleration means the 5DMA is twice its 20D-MA. You can think of it as a vehicle (investment)  driving on a highway. On certain time, the vehicle shifts up or down and the heartbeat shows the actual velocity change.

Cave Explorer
This is a new chart tool launched June 11, 2020. It shows the 5DEMA (5-Day Exponential Moving Averages) of the Market's High and Low (RED Boundaries) as well as the 5DEMA of the X-Price (YELLOW). The longer trend 20DVWMA Market Highs and Lows are also featured to show the Volume biased bounds of the 20 day High and Low Price.

The 20 Day VWMA of highs and lows shows a safe spot where the path should be based on previous data where strong trends occur. This makes it a potential plot points for resistance and support. In this case its for short term swing trading. When the "Cave Ceiling" (5DEMA HIGHs) passes through the VWMA Floor level, it can indicate a bullish trend. once it passes through the VWMA Ceil, the trend can still rise but caution is adviced  as you have reached the unknown. For potential downtrends, the reverse holds true but instead, we look at the "Cave Floor" (5DEMA LOWs) passing through the 20DVWMA Ceiling.

Another way to play it is that when the "Cave Ceiling" is below the VWMA FLOOR PRICE, use the stated VWMA FlOOR PRICE as your entry point (BUY TRIGGER). when the 5DEMA trend seems collapsing from its bull run, if the "Cave Floor" falls through the VWMA CEILING PRICE which is your exit (SELL TRIGGER).

Tuesday, June 2, 2020

What is ASTRA's stock market X-PRICE?


ASTRA (Automated Stock Trader Analyzer of The MyPinoy Network) uses a specific price for its analysis and reports. Most traders utilize what is known as the "last" price which is the closing price which the majority deem as the correct and "final offer". However ASTRA does not believe that the last price should be the only determining factor for what the "real" price is. So in this article, we will explain why it believes that to be the case and how it tries to approximate what makes up for a "xensible" price! We could've used VWAP (Volume Weighed Average Price) but we do not have the luxury of achieving these data, particularly for free and better yet if in real-time. But as you know, we fund this "pet" project and we are just a very tiny team who just play stocks and share our expertise. we are not multi-millionaires here :p 

ᐈ Astrology stock illustrations, Royalty Free astrology vectors ...

First let's start with this... The market (specially the PSE) is emotions driven! if you do not agree or is curious why ASTRA feels that way, please first check out our previous article on the matter here. For ASTRA, the stock market is like a board game with rules, a playing field and players. Players determine the trade types and politics of it. As with almost all things in life, it believes the game is also manipulated! Anything that can be gamed will be gamed and the more money there is to gain doing so without repercussion, the more enticing it is to do so.

For ASTRA, the market is "NOT LOGICAL" because if it was, Fundamental Analysis would have been correct 80% to 90% of the time. We are not discrediting the importance of fundamentals but ask yourself this... do you trust companies file their quarterly reports completely and honestly? No bloating of figures? No magic accounting involved? no bribing of officials auditing their cooked books? and when these are discovered... what happens? company can just basically "apologize and promise to do better next time". So basically, there is no true risk and more to gain when you play dirty. Sad to say this but we will not blind ourselves just for the sake of sounding nice... This is the norm in the Philippines and until we implement strong punishment for such practices, this will always be the norm and fundamentals are theoretically useless when trust is almost 0.

Bob Jensen's Accounting Theory Summary Part 1

So if fundamental analysis fails here, what works is "trend/sentiment analysis" as we Filipinos are "emotionally driven". What triggers us are hypes and fears, booms and busts, pump and dump, and so on... any good news we start to rally and any bad news we sell like its the end of the world. BTW! We will not blind you guys to the idea that everything is predictable and sensible. As long as there are Human Factors (Emotions) the market will only make sense to those who understand human behavior and how to predict their actions. The ASTRA project aims to understand trends of trader behavior, manipulation events and how it can predict potential optimism and pessimism in trade activities. 

Daily market values
[For those who already understand price HIGH, LOW, OPEN and CLOSE(LAST) you may skip this paragraph as it is intended for those new to stocks.]
Everyday after trading hours and market has closed, the stock market summarizes the daily results indicating the following

  • High - The highest price of the stock on the trading day
  • Low - The lowest price of the stock on the trading day
  • Open - The initial price of the stock on the trading day
  • Close/Last - The last price of the stock on the trading day
all these data can be used as a whole to see trends (i.e. using the candlestick chart). We will not delve too much on explaining these as there are more guides on using these online and our focus is more into our own methodology on measuring/scoring the "actual day value""


The X-Price
Most analysis revolved around the "Last price". We are not saying its wrong but in our case, it never did us any better because like we said "The Market is rigged!"... Theoretically, most volumes of trade should happen "in-between" the trading hour. But there are lots of instances (specially in the PSE) where the trade actually happens on 2 particular periods... the Open and Close. This usually happens (in our point of view) when people want to manipulate the stock. opening prices where a spike in volume causing massive buying will trigger people to want to ride the wave due to FOMO (Fear of missing out). An example of this happened just this early May of 2020. ABSCBN was ordered to shutdown, that night forums are hyping to buy GMA7 (its competitor). This however has no basis other than FOMO Greed and Human Emotions. In just a span of 2-3 days, people who jumped in lost 30% of their money.

The opposite is true when these entities oversells shares early to cause panic selling (with the objective of buying them back later cheaper). Also when done on the last trading minute, the people who are not active will normally use the "Last Price" as a deciding factor on its value.

Hence we utilize a 5th price (The X-Price) which is a weighted value based on the 4 values mentioned above. The X-Price does not fully trust each values entirely and tries to guess the daily average based on these 4 data. The forumula is ran as such (simplified for understanding purposes only):

  1. First we impute the value based on the open and close where the weighed is geared more towards the closing price. XPRICE_1 = ((LAST_PRICE x 2) + OPEN_PRICE) / 3
  2. Then using the High and Low price, add it to twice that value and divide by 4.
    XPRICE = ((XPRICE_1 x 2) + HIGH_PRICE + LOW_PRICE) / 4
The X-Price as can be seen, tries to estimate where within the day value the real average is and not listen to its "edges" alone (LOW, HIGH, OPEN or CLOSE). First we "averaged" the open and close price with weight geared towards the LAST/CLOSE price. Then, using this value, We added in the HIGH and LOW value wherein the OPEN-CLOSE average is given higher weight. Not too complicated right? See the table below to see how the X-PRICE will appear and how it makes a more sensible price range to lessen the trading day's noise.

 LOW HIGHOPEN LASTX
 15 30 2025  22.92
 5 30 20 30 22.08
 20 50 20 23 28.5
 5 40 20 40 27.92

As can be seen in the results above, no single value dictates the "possibly true day value". Each one can pull the amount in the opposing direction where the weight is geared primarily on the LAST trade value, then OPEN value and the HIGHs and LOWs.

Use Cases
The X-Price basically helps you see what would make a "xensible" price for that day, meaning the next trading day, there is high probability that the price range will hit this value. Its use is enhanced with the XMA (Price X Moving Average) and XVWMA (Price X Volume Weighed Moving Average) which are some of the unique metrics provided by ASTRA. Moving forward, note that any metric or data you will find on this system with an 'X' simply means it was determined using this X-Price. (i.e. priceX5dMA, priceX5dVWMA, priceXChangeVal, etc. our moving averages and most graphs will focus on this as well and not on LAST trade prices)

Why does the Stock Market not follow the economy or the company's fundamentals?

We all probably have encountered this question during our stock trading plays and had became victims of NEWS channels expressing how large the economy is growing, how company ABC has doubled its revenue, or its exact reverse of bad news. We traded accordingly and then BOOM! the market went the exact opposite direction. 

10 Investing Lessons From Dilbert Creator Scott Adams and Vanguard ...

You will often get the advice or blame yourself that it is because you lacked further research on the company. Or maybe, you will do some DaVinci Code level correlation trying to find and map the incident to any NEWS that could have made the market swing that way and confirm anything you find as "the fact" which you discovered too late. And don't get me started on people bragging in public groups and forums about their "lucky" trade and stating that its because they knew about Fact-X which only a few like them know, yet they hide to the public the rest of the reds in their portfolio.

I will not give you the same BS and admit that the stock market has never been nice to me! I have tried the PSE, US Stocks and Forex and I have incurred losses mostly applying the same techniques known by the majority. I have learned a lot from free online resources just like the majority and is part of that +90% losing rate of the majority[1]. So here is my learning regarding to that... "If you do what the majority does, don't expect to produce something different!" or in the case of Einstein...


Albert Einstein Quote -The definition of insanity is doing the ...

Wait! did he just say more than 90% of the traders lose??? Yes that is so true and you should be aware of that! The reason you win in the stock market mostly is not because the company you invested in grew, but because someone lost the opportunity of earning to you! and the more you earn means the more people you managed to grab these opportunities from! That is what's known to the 10% of the players who work around that knowledge and are potentially the cause most of the manipulations. But don't worry, the answer to the question above is NOT a plain boring answer called "manipulation". If you are interested to know how rigged the Philippine Stocks Exchange is, please check this article.

Now if you've seen our site The MyPinoy Network, you will notice that it does not utilize the same tools used in the market. This is our way of "doing something different" and not following the tools and techniques of the 90%. It uses a bot/processor called ASTRA (Automated Stock Trading Report Analyzer) which dissects the day to day trends and tries to make a more "xensible" (with an x) way of understanding a particular stock trend. It is however never gonna be designed to analyze fundamentals like P/E Ratio, ROI, EPS, etc. It does not believe in fundamentals... at all! Its not that we (who are working on the project) do not value fundamentals... its just that ASTRA is made to be skeptic about it or even see it as senseless. To make it easier, lets just say ASTRA is a technical trader!

Battle of two Schools
Naruto and Sasuke meet in the Final Valley (com imagens) | Cosplays

There are basically 2 conflicting school of thought who play the stock market. Those who use fundamentals and those who use technical analysis. Fundamentalists look into the strength of a company and the market environment before making a decision. A technical trader however is like that guy who just sits on the bench, looking at the foot traffic all day observing where the people buy their stuffs and determine which business is trending or dying. To simplify, the Fundamentalists are investor while the Technical Analysts are traders. Since fundamentalists knows more on the internals (at least based on the company's prospectus and quarterly data) and the direction of the economy, then that means the market should easily be predicted by them and they will be most of the time correct! then why is that not the case recently?

So are fundamentals dead? Ok let me explain it this way... one of the most surprising documentary that changed my view on the stock market is Betting on Zero (NETFLIX) which I will recommend to anyone. It is a documentary of famous Short Sell Activist Bill Ackman exposing how Multilevel Marketing "Herbalife" does not really have sound fundamentals and it is living off at the expense of its new members (Pyramiding). All this however failed to bear fruit as Carl Ichan uses his endless supply of wealth to keep the company afloat just to prove that Bill Ackman whom he hates would fail and be humiliated. This proves one truth! fundamentals are useless and a company's survival and strength are just as strong as whoever is "investing" or "manipulating" its numbers. Amazon is losing money in its shipping and cheap price products selling at a lost? no problem! once it kills all those small businesses that are losing market share, Amazon will be the lone survivor! also it gets fund from its other money generating business (AWS CLOUD)! but like I said, we will not use that simple explanation.

So where is the market correlated then if its not "Fundamentals"? Its very simple really, remember we explained the two school of thought? The market is like Yin and Yang, supply and demand, bulls and bears, fundamentalist vs technical traders. Each one force competes to get the best deal or "correct" price. But is this mix always 50-50 balanced? no its not unless we call on Thanos right?
Perfectly Balanced | Know Your Meme

Why it works before? well... because there are less traders! and by traders I mean technical analysts. The stock market used to be "A rich man's game" remember? Rich men with strong education usually use "logic" as a deciding factor. WHAT??? So are you saying the technical traders are stupid??? No! of course not! The technical traders work on a different aspect of intelligence... successful fundamentalist use their I.Q. as their strength, successful technical traders use E.Q. as their strength. 

fundamentals lol? just tell me who the best character is ...

Now imagine a new stock market game, the players are composed of 9 fundamentalists and 1 technical trader... which kind of trades do you think will happen mostly in the market? Fundamentally sound trades of course! here comes the new millennia and everyone has access to the stock market! fundamentals are too tedious to learn and perform than just sitting on a bench, watch where people go and just "follow the market"... now let's play a new game! this time, a market where there is only 1 fundamentalist and 9 technical traders... you might yell after losing how screwed and emotionally driven the game is but you are right! Just like any political and conflict based game-boards I have played, the fun and diversity is made by the player mix! when you play against emotionally driven people, the game becomes emotional and political as well. When I play with logical and calculating people, the same game becomes a battle of wits.

Grandma Finds The Internet Meme - Imgflip

The stock market is no different and the conflicting market force just proves what kind of people are inside specific markets. So what player mix is in the PSE? it is definitely emotions driven and is why technical analysis is for us, the only way to really play the game. Also, not insulting the Philippine based companies, but with our global image for corruption, lack of process, standards and adherence to the law... continuous violations with no real punishments, scandalous global incidents such as AMLA violations, environmental destruction, questionable affiliations, trade relations and more... can one truly trust what these companies show in their quarterly report figures? I mean seriously? even we as Filipinos ourselves basically know most of these companies are not really a reflection of how they try so desperately to "market" themselves to be.

References:
[1]Shocking But True: 90% People Lose Money In Stocks - Research & Ranking

The PSE is being hacked by "Market Hackers" and YOU are one of them!

So if you've read my previous blogs on the matter, you should have known by now that while we do play the market, we believe that is a R...